pytrnsys_process.plot.plot_wrappers.line_plot#
- pytrnsys_process.plot.plot_wrappers.line_plot(df: DataFrame, columns: list[str], use_legend: bool = True, size: tuple[float, float] = (7.8, 3.9), **kwargs: Any) tuple[Figure, Axes][source]#
Create a line plot using the provided DataFrame columns.
- Parameters:
df (pandas.DataFrame) – the dataframe to plot
use_legend (bool, default 'True') – whether to show the legend or not
size (tuple of (float, float)) – size of the figure (width, height)
**kwargs – Additional keyword arguments are documented in
pandas.DataFrame.plot().
- Return type:
tuple of (
matplotlib.figure.Figure,matplotlib.axes.Axes)
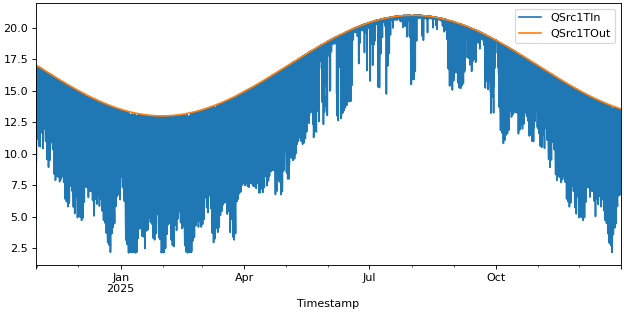
Examples
>>> api.line_plot(simulation.hourly, ["QSrc1TIn", "QSrc1TOut"])