pytrnsys_process.api.energy_balance#
- pytrnsys_process.api.energy_balance(df: DataFrame, q_in_columns: list[str], q_out_columns: list[str], q_imb_column: str | None = None, use_legend: bool = True, size: tuple[float, float] = (7.8, 3.9), **kwargs: Any) tuple[Figure, Axes][source]#
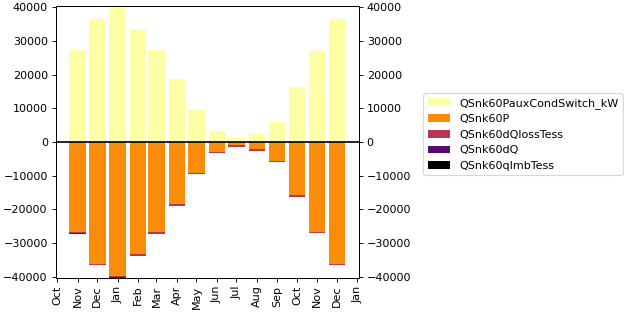
Create a stacked bar chart showing energy balance with inputs, outputs and imbalance. This function creates an energy balance visualization where:
Input energies are shown as positive values
Output energies are shown as negative values
Energy imbalance is either provided or calculated as (sum of inputs + sum of outputs)
- Parameters:
df (pandas.DataFrame) – the dataframe to plot
q_in_columns (list of str) – column names representing energy inputs
q_out_columns (list of str) – column names representing energy outputs
q_imb_column (list of str, optional) – column name containing pre-calculated energy imbalance
use_legend (bool, default 'True') – whether to show the legend or not
size (tuple of (float, float)) – size of the figure (width, height)
**kwargs – Additional keyword arguments to pass on to
pandas.DataFrame.plot().
- Return type:
tuple of (
matplotlib.figure.Figure,matplotlib.axes.Axes)
Examples
>>> api.energy_balance(
>>> simulation.monthly,
>>> q_in_columns=["QSnk60PauxCondSwitch_kW"],
>>> q_out_columns=["QSnk60P", "QSnk60dQlossTess", "QSnk60dQ"],
>>> q_imb_column="QSnk60qImbTess",
>>> xlabel=""
>>> )